Example

The table below explains the fields on the Report Details panel.
|
Field |
Description |
|
Name |
The name of the report. This must be unique within all users and categories. |
|
Source View |
The name of the view that is used for this report. |
|
Report Type |
Select from List, Cross Tab, or Historical. |
|
Report Style |
Select from Standard With Grids or Standard Without Grids. The gridlines appear on the chart section of your report output. The System Administrator can define further styles and make them available from this field. |
|
Rows Per Page |
This option is displayed for List reports and applies to on-screen output only. Enter the number of rows you want to see per page. When the rows per page is set, the first page is displayed as soon as it is generated, with arrows at the top to go to the next or last page. If you click on the next or last page buttons before that page has been generated, a message is displayed, advising that the page is not yet ready. Once the whole report has been generated, a Go To page icon is displayed at the top of the page. Note: The rows per page setting does not count the report header, title, and footer as rows. For example, 20 rows per page means 20 rows of data per page, including total lines, blank lines, and charts. A Print Preview icon is also available, which opens a new window containing the full report as a PDF. |
|
Description |
A free text description of the report. |
|
Private Report |
If checked, then only the user who created the report can see the report in the Report list. |
|
Auto Hyperlinking |
Creates hyperlinks from the content in the report columns to the record in CRM. For example, click on hyperlink of Company Name on the Report Output page, and the Summary page of the selected Company is displayed. |
|
Show Original Currency Values |
Displays the currency values entered in the system, rather than the user’s preferred currency. Note: Currency fields display in reports to the decimal precision defined by the System Administrator in the Base Currency. Numeric fields display in reports to the decimal precision defined in My CRM | Preferences. |
|
Filter By Current User |
Allows the user creating the report to limit the returned data to be applicable to the current logged on user. For example, the report output of a Communication List report, will automatically be restricted to show Communications scheduled for the logged on user. |
|
Filter By User’s Primary Team |
Allows the person creating the report to limit the returned data to be applicable to the logged on user’s Primary Team. For example, the report output of an Opportunity List report will automatically be restricted to show Opportunities assigned to the Primary Team of the logged on user. |
|
Filter By User’s Home Territory |
Allows the person creating the report to limit the returned data to be applicable to the logged on user’s Home Territory. For example, the report output of an Opportunity List report will automatically be restricted to show Opportunities in the Home Territory of the logged on user. |
|
Select Distinct Values |
Removes duplicate rows in the report output. For example, if you have a report that lists all companies that have "High" priority Cases, and there are two high priority Cases with the company Design Right, Design Right appears twice in the report output. However, if you choose the option Select Distinct Values for this report, Design Right only appears once. |
The buttons on the Select Column panel on the Report Source page are explained below.
Add To Report Contents. Adds the column to the Report Contents list. These will make up the report columns (the first item in the list will make up the first report column on the left hand side of your report, the second item the next column along, and so on).
Add To Search Criteria. Adds the column to the Search Criteria list. These will be the criteria that you can filter your report output by. In the example above, selecting Assigned To as a search criteria means that when you run the report, you can decide to view opportunities for just one or a selection of Sales Reps.
In the report designer, you cannot delete fields from the Search Criteria list if the report has saved searches. Please refer to the Saving Report Search Criteria for more information.
Advanced Find. Allows you to use the Advanced Find feature to create the report. When Advanced Find is selected the next screen displayed will be the Advanced Find page, where you can create complex queries to return specific report results. For more details on using advanced find, please refer to Using Advanced Find.
Add To Sort On. Adds the column to the Sort On list. The report will be sorted by this column. If there are multiple columns in this list, the report will sort first by the column at the top of the list, then by the next column. Note that if you have added Group By columns, these will make up the "primary" sort order. The columns within the Sort On list determine the sort order within the group.
Add to Group By. Adds the column to the Group By list. The report results will be grouped by the columns in this list. In the above example, the opportunity list is grouped by Sales Rep (Opportunity Assigned To). Note that you do not need to select the Group By column as one of the Report Contents columns. The Group By selection creates its own column as the very first left hand column of the list report.
Add Key Attribute Data. Key Attribute data can also be added to the report. For example, if you have Key Attribute data set up to track subscribers to a Partner Newsletter, this can be included in the report contents.
Fields on the report formatting panels (Title, Header, Summary, Footer, Sort Orders, and Column Formatting) are described below:
|
Field |
Description |
|
Title |
The title to be displayed on the report. This title also forms the name of the Chart gadget on the Interactive Dashboard. If you clone a report with a chart in it, it is recommended that you update the chart title in the cloned report. |
|
Left Content (Header) |
The header appears at the very top of the report before any other details. The header and footer are divided into three sections; left, center, and right. The same set of options can be displayed on each section: Date. Current date, formatted according to the user's preferences. Date Time. Current date and time formatted according to the user's preferences. Logo. Displays a logo. The logo must be a file called LOGO.JPG Page Number. Displays the page number on HTML and Adobe reports. Report Title. Displays the title of the report. Time. Current time, formatted according to the user's preferences. User Name. The name of the user who is running the report. For more information on customizing FusionCharts, please refer to Customizing Report Charts in the Themes section of the System Administrator |
|
Centre Content (Header) |
See above. |
|
Right Content (Header) |
See above. |
|
Show Summary Data |
If checked, the grand totals are displayed. |
|
Left Content (Footer) |
The footer appears at the very end of the report underneath all other details. See above. |
|
Centre Content (Footer) |
See above. |
|
Right Content (Footer) |
See above. |
|
Group Orders |
This section is only displayed if columns have been added to the Group By list on the Report Options, Step 1 of 2 page. See "Sort Orders" below for an explanation of the three columns. |
|
Sort Orders |
This section is only displayed if columns have been added to the Sort On list on the Report Options, Step 1 of 2 page. Each field is listed in a grid in three columns. The first column displays the name of the field and the second column displays a check box with the column heading "Descending". If this check box is selected, the field is sorted in descending order. The default is in ascending order. The third column gives you the option to sort by Caption Order or by Translation Order. When you create drop-down list captions, it is possible to specify the order that they appear in using the Caption Order field in Translations. This is the order that will be used if you select Caption Order. Translation Order is the alphabetical order of the actual translation of the column in the language of the user running the report. If neither is selected, the default is alphabetically on the Caption Code. |
|
Column Formatting |
This section lists all of the columns (except Group By columns) that are displayed on the report. For each field listed there are three options. The first option is the name of the field, the second option allows you to specify a total for the column. There are five types of totals, Average, Count, Maximum, Minimum, and Sum. All five types are available if the field is a numeric field. For non-numeric fields only Count is available. The third option is for alignment, there is a radio-group with three options: left-justify, center-justify, and right-justify. |
The table below explains the fields in the Chart Options panel.
|
Field |
Description |
|
Show Chart |
Check to show a chart. |
|
Available On Classic/Interactive Dashboard |
When checked, the chart is available for selection from the Report Charts category on the Classic or Interactive Dashboard. Refer to Adding Report Charts to a Classic Dashboard or Chart Gadget for more information. |
|
Chart Style |
The type of chart you want to display. Available styles include Line, Bar, Horizontal Bar, Pie, Area, Point, Fast Line, Doughnut, Pyramid, and Funnel. Please refer to Chart Styles for examples. |
|
Show Legend |
Toggles the legend display on or off. |
|
Legend Alignment |
Aligns legend bottom, top, left, or right. |
|
Value |
Indicates what column is to be used for the left axis of the chart. |
|
Label |
Chart label for the left axis. If this is blank the translated field name is used. |
|
Function |
Indicates what totalling function to use on the left field. The returned values of the left field must be numeric. Valid options for this field are Average, Count, Minimum, Maximum, and Sum. Only numeric fields have all five options, non-numeric fields only have the Count option. Because the returned value must be numeric, non-numeric fields always have the Count option selected. Numeric fields can also specify no totalling since the underlying field value is numeric. |
|
Category |
The field to be used for the bottom axis of the chart. |
|
Label |
The caption to be used for the bottom axis. If this is blank the translated field name is used. |
|
Function |
Only applicable if the Category field is a date/time field. Allows the value of the field to be split up into date ranges like month names. |
|
Group By |
If a Group By option was selected in the Report Options Step 1 of 2 page, this field is displayed on the Chart Options panel. It displays a separate chart per grouping. |
|
Multi-Bar |
If the Group By field is filled in the Chart Options, a further field, Multi-Bar, is displayed. This displays all the groups on each chart. |
| Chart Style |
Example |
|---|---|
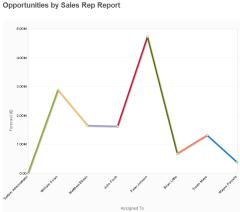
| Point, FastLine, Line |
|
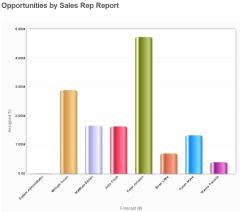
| Bar |
|
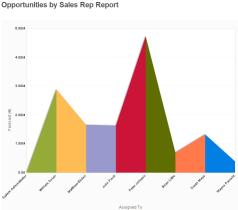
| Area |
|
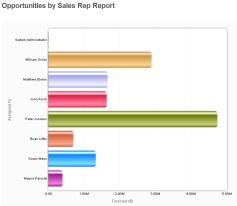
| HBar |
|
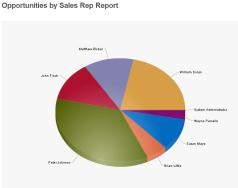
| Pie |
|
| Doughnut |
|
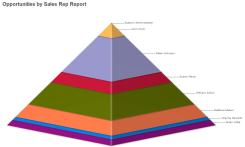
| Pyramid |
|
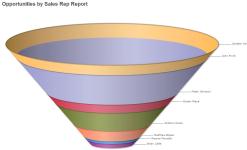
| Funnel |
|
See Also:
Creating a Cross Tabular Report
Key Attribute Profiling. Refer to the System Administrator Help.
|
User Requirement: Info Manager Administration Rights |